SPX 0DTE Put Credit Spread Strategy
The New ASD 0DTE Put Credit Spread Strategy
One of the newest additions to Alpha Crunching is the ASD 0DTE PCS strategy, and it’s been showing promising results over the past couple of years. Below we'll cover what ASD is, how to use it to filter trades, and the exact trade rules we’ve been following.
What is ASD?
ASD stands for Average Strength Deviation. It’s a metric shown below the Daily Forecast for each day of the week.
- It compares the current week’s final cumulative forecast value against the 3-week average.
- The result is displayed as a percentage deviation.
- A positive ASD means this week’s forecast is stronger than the recent 3-week average, suggesting bullish continuation.
📊 Here's an example of positive ASD value below the Daily Forecast.
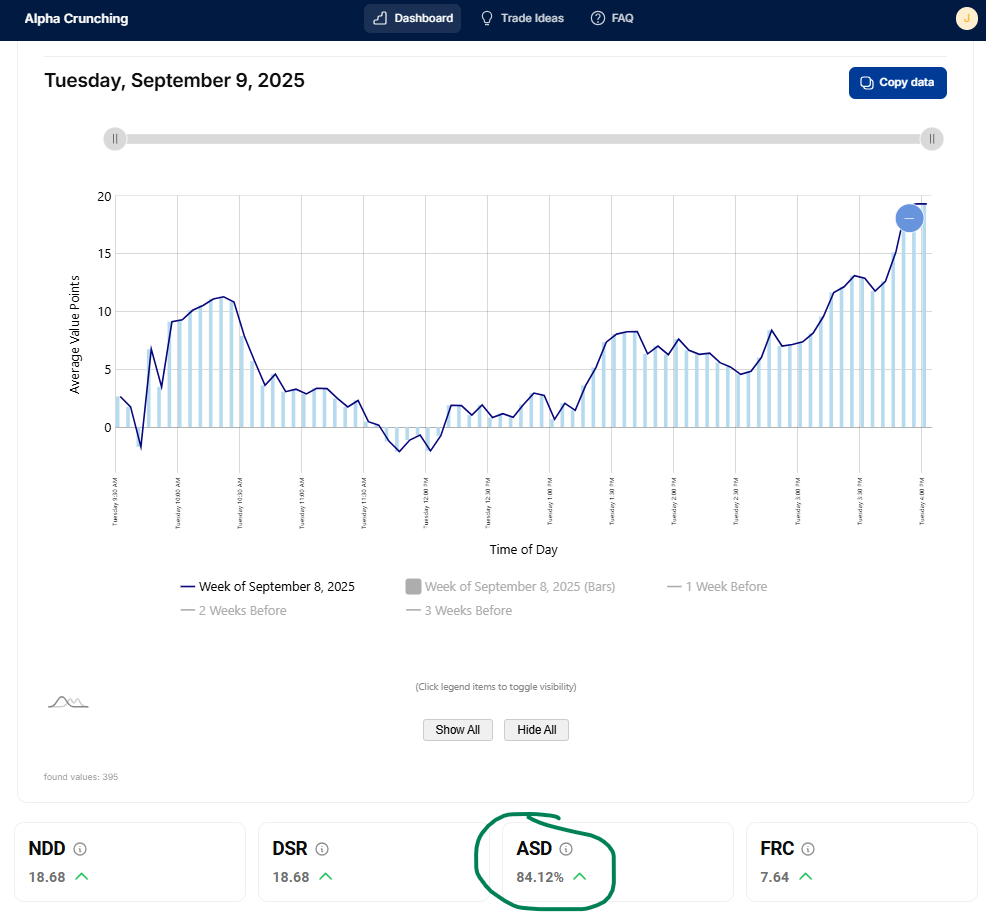
Like all Alpha Crunching forecasts and metrics, these values are available before the trading week begins, so you know ahead of time which days may have higher probability setups.
Step 1: Identify Positive ASD Days
Before the week begins, mark which days show a positive ASD. These are potential candidates for the strategy.
Step 2: Real-Time Confirmation
On a positive ASD day, we look for bullish confirmation before entering:
- At 1pm ET, check the SPX daily chart.
- Price should be above the 2sma, signaling short-term bullishness.
- Then, check the SPX 1-minute chart.
- The 20ema should be above the 40ema, confirming intraday bullish momentum.
- If either moving average condition is not present at the time of trade, the trade is simply skipped.
Step 3: Trade Setup
- If moving average conditions are met, enter a 0DTE at-the-money Put Credit Spread (5-wide).
- Require a minimum credit of $1.80.
- Hold to expiration – no stops, no profit targets.
- This keeps management simple.
- Position sizing stays consistent.
- No PDT issues since trades are not closed intraday.
👉 More advanced traders may layer in their own risk management, but the above parameters are designed to keep the strategy simple and mechanical.
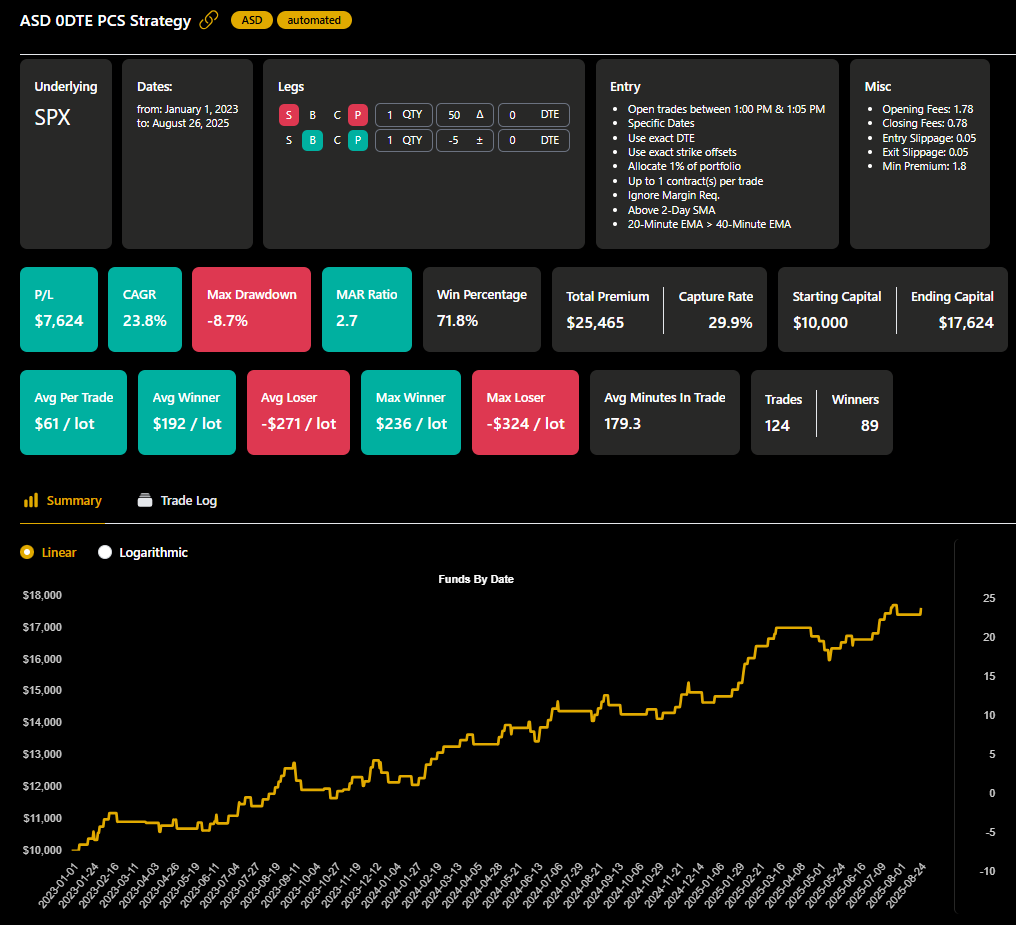
Performance Results
From Jan 2023 – Aug 2025:
- 124 trades taken.
- 72% win rate.
- Average win: $192.
- Average loss: $271.
- Average per-trade expectancy: +$61 (about a 20% return per dollar risked).
- P/L curve: smooth upward slope, making money every year in the lookback period.
Why This Matters
The ASD metric helps traders identify whether the current week is likely to continue its recent strength or deviate from trend. By combining that forward-looking signal with simple intraday confirmations, the strategy has produced consistent results while remaining easy to manage.
If you’re looking for a mechanical, rules-based 0DTE approach, this strategy is a great place to start.

.avif)
.avif)